Analyzing a boat listings website

Data analysis with Pandas and data visualization with Seaborn regarding a boat listing website | Most popular boats, prices, etc..
Published on December 08, 2021 by Andrés Ingelmo Poveda
jupyter notebook python data analysis pandas seaborn data visualization
8 min READ
What do you do when you want to sell your boat? You can either sell it to a friend or relative or post it online. This is the reason why boat listings websites exists. In this blog post, I will try to analyze the main common patterns of the most viewed ads within the last 7 days. This analysis was part of my DataCamp Data Analyst certification.
Dataset
The dataset contains almost 10,000 observations of boat ads from an unknown website. It has the following structure:
Data columns (total 10 columns):
 #   Column                       Non-Null Count  Dtype
---  ------                       --------------  -----
 0   Price                        9888 non-null   object
 1   Boat Type                    9888 non-null   object
 2   Manufacturer                 8550 non-null   object
 3   Type                         9882 non-null   object
 4   Year Built                   9888 non-null   int64
 5   Length                       9879 non-null   float64
 6   Width                        9832 non-null   float64
 7   Material                     8139 non-null   object
 8   Location                     9852 non-null   object
 9   Number of views last 7 days  9888 non-null   int64
As we can see, the data is not clean enough. A lot of observations are missing and, well, the price column contains different currencies so… If you want to check out all of of the steps I followed to clean up the data. Please, check out the jupyter notebook associated with the post.
After cleaning the dataset, I decided I was gonna create a filtered dataframe with the top 1% of the most viewed ads. Why? Because they represent almost 7% of the total views and I think it is representative enough. Don’t forget, we are trying to check out the top performing ads to look for common patterns.
The filtered dataframe looks like this:
| Boat Type | Manufacturer | Type | Year Built | Length | Width | Material | Location | Number of views last 7 days | Price_EUR | |
|---|---|---|---|---|---|---|---|---|---|---|
| 9580 | Motor Yacht | Bayliner power boats | Used boat,Unleaded | 1992 | 7.7 | 2.46 | Plastic | Switzerland » Le Landeron (NE) | 3263 | 14304 |
| 8723 | Hardtop | Princess power boats | Used boat,Diesel | 1979 | 11.12 | 3.88 | GRP | Switzerland » Neuenburgersee » Hauterive | 2432 | 33600 |
| 6211 | Bowrider,Motor Yacht,Sport Boat | Windy power boats | Used boat,Diesel | 2002 | 12.35 | 3.48 | GRP | Switzerland » Lago Maggiore » 6600 Locarno | 2261 | 120864 |
| 3700 | Hardtop | Pershing power boats | Used boat,Diesel | 2009 | 20.3 | 5.2 | GRP | Neustadt in Holstein (Ostsee) | 2154 | 949000 |
| 308 | Sport Boat | Sea Ray power boats | Used boat,Unleaded | 1993 | 6.14 | 2.34 | Plastic | Switzerland » Murtensee » Avenches | 2026 | 19104 |
Exploratory data analysis
By taking a look at the most characteristic statistics, we can draw some conclusions. Lets take a look at the top performers statistics:
| Year Built | Length | Width | Number of views last 7 days | Price_EUR | |
|---|---|---|---|---|---|
| count | 80 | 80 | 80 | 80 | 80 |
| mean | 1997.88 | 9.82725 | 3.129 | 1202.56 | 558834 |
| std | 20.1942 | 7.1716 | 1.47437 | 445.153 | 3.51186e+06 |
| min | 1901 | 3.35 | 1.55 | 859 | 3648 |
| 25% | 1989 | 6.3 | 2.355 | 895 | 21336 |
| 50% | 2003 | 7.5 | 2.59 | 1019 | 46280 |
| 75% | 2011.25 | 11.03 | 3.4575 | 1327 | 93400 |
| max | 2020 | 54.4 | 9.95 | 3263 | 3.1e+07 |
And the whole dataframe ones:
| Year Built | Length | Width | Number of views last 7 days | Amount | Exchange_EUR | Price_EUR | |
|---|---|---|---|---|---|---|---|
| count | 9246 | 9246 | 9246 | 9246 | 9246 | 9246 | 9246 |
| mean | 2004.92 | 11.7174 | 3.55226 | 150.431 | 320240 | 0.98518 | 301920 |
| std | 16.4064 | 6.00027 | 1.21254 | 155.088 | 979004 | 0.122769 | 940032 |
| min | 1885 | 1.04 | 0.01 | 13 | 3300 | 0.13 | 3203.52 |
| 25% | 1999 | 7.56 | 2.55 | 70 | 45000 | 1 | 44500 |
| 50% | 2008 | 10.5 | 3.38 | 108 | 98000 | 1 | 95000 |
| 75% | 2018 | 14 | 4.26 | 172 | 259000 | 1 | 249000 |
| max | 2021 | 100 | 25.16 | 3263 | 3.1e+07 | 1.17 | 3.1e+07 |
Just by taking a look at the two tables from above, we can get some valuable information:
- The median boat in the top listed ads is older (2003 vs 2008).
- The top performer boats are smaller in length and width.
- The median price of the most viewed boats is cheaper.
Let’s perform some data visualizations to check out our hypotheses!
Data visualizations
Let’s start by asking the following question: do more expensive boats receive more views?
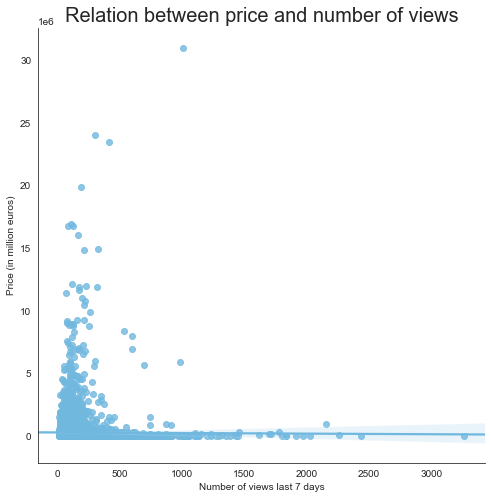
As the graph shows, there is not any positive relation between the number of views and the price. This means that the most expensive boats are not getting the majority of attention and it makes sense. People may want to see expensive and overpriced boats but they are not functional. Majority of them cannot afford them so they search for more affordable options.
Now, let’s check if the year they were built matters. Do the newer boats make to the top of the list?
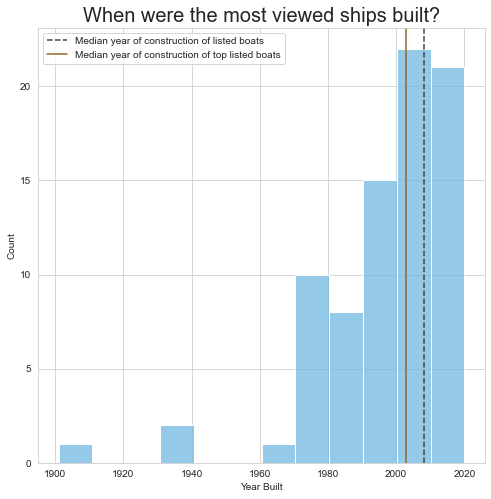
And, as we can see, the top 80 most viewed boats are pretty new, but not as new as the total. The median of the most viewed boats was 2003 while the whole dataset was 2008. We can say that older boats can have a higher chance of being in the top positions of the list.
Does size matters?
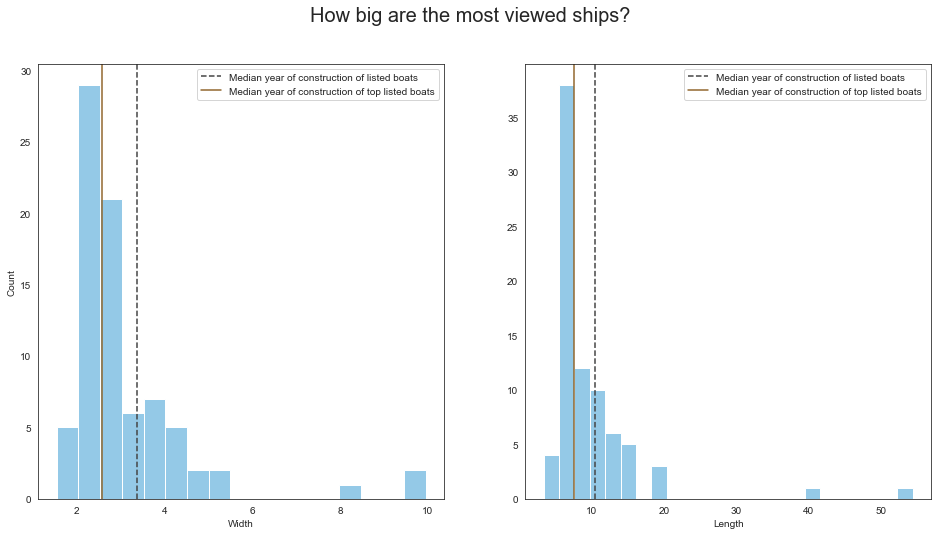
We can get some important insights from this visualization. The most viewed boats are smaller than the average ones listed on the site. The majority of them are 3 meters wide and 7.5 meters long. This means that people prefer smaller ships. And again, it makes sense. Smaller ships are usually more affordable.
Now we now that users prefer older and smaller ships, probably because they are cheaper. Let’s try to figure out the most common type of boat.
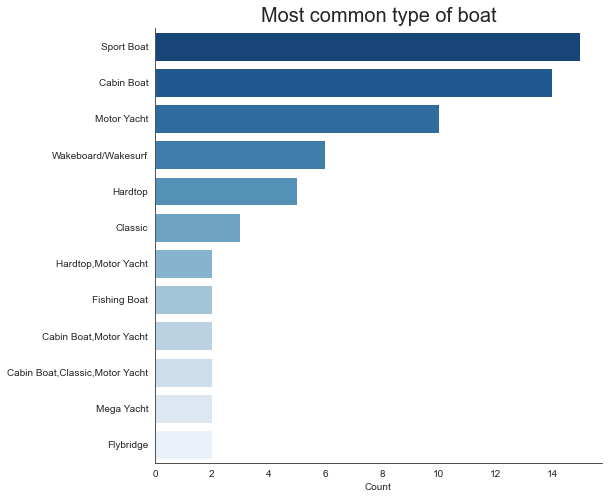
And yes! Sports boats are the most popular ones on the site. This boats are usually small and cheap. People can afford them so they are more likely to be on the top of the rank. Cabin boats are also small and affordable so, selling those type of boats, will give the users more chance of being visible.
Let’s check the most common type of material.
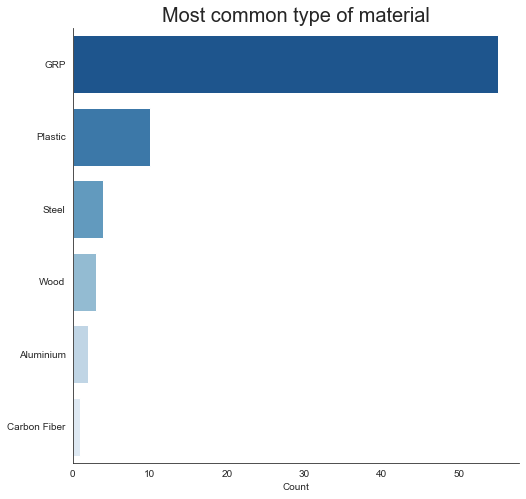
And we have a winner! GRP (Glass Reinforced Plastic) is the most common type of material for boats! Pound for pound, GRP is lighter and stronger than aluminum or steel. Smaller boats are usually made of this so, its another reason to take into account regarding why smaller boats are so popular.
Conclusion
Here it comes! The part we were all waiting for…
After analyzing the whole dataset with the objective of showing what are the common characteristics in the most viewed boats, we can conclude the following:
- Cheaper boats make the top of the list.
- Smaller boats as well.
- Sports and cabin boats are the most common ones.
- GRP is the most common material.
Putting all previous insights together, we can say that announcing a well-priced boat, which is usually smaller, will give the user more probabilities of being visible than a big and expensive boat. People are using the website to buy sports and cabin boats, probably because they are more affordable than yatches.
If you liked my article. Please, consider reading another one from my blog or checkout my projects.