Should I deploy my new website? Or better keep the old one? (Part 1 - Bootstrapping)

A/B tests are very commonly performed by data analyst. In this post, I'll run some tests to help a fake company understand if they should implement the new page or keep the old one.
Published on October 22, 2021 by Andrés Ingelmo Poveda
pandas jupyter notebook data analysis A/B test probability
5 min READ
One of the most common questions when building a new website is: will it perform better than the old one? Would people like it more? This is where A/B testing excels. This experiment allow us to compare two different samples and draw conclusions out of them. For example, the old page (A) against the new page (B).
Dataset
The dataset used in this analysis was provided by Udacity and it follows the next structure:
<class 'pandas.core.frame.DataFrame'>
RangeIndex: 294478 entries, 0 to 294477
Data columns (total 5 columns):
 #   Column        Non-Null Count   Dtype
---  ------        --------------   -----
 0   user_id       294478 non-null  int64
 1   timestamp     294478 non-null  object
 2   group         294478 non-null  object
 3   landing_page  294478 non-null  object
 4   converted     294478 non-null  int64
dtypes: int64(2), object(3)
memory usage: 11.2+ MB
We may even have a look at the first five observations to get a clear sight of what we are working with:
| user_id | timestamp | group | landing_page | converted | |
|---|---|---|---|---|---|
| 0 | 851104 | 2017-01-21 22:11:48.556739 | control | old_page | 0 |
| 1 | 804228 | 2017-01-12 08:01:45.159739 | control | old_page | 0 |
| 2 | 661590 | 2017-01-11 16:55:06.154213 | treatment | new_page | 0 |
| 3 | 853541 | 2017-01-08 18:28:03.143765 | treatment | new_page | 0 |
| 4 | 864975 | 2017-01-21 01:52:26.210827 | control | old_page | 1 |
Data preparation
In order to begin the analysis, we need to prepare the data by distributing it in two different groups:
- Treatment: people who received the new landing page
- Control: people who received the old landing page.
The probability of receiving any of the pages is 50%. Another important data is the conversion rate for each of the groups:
| group | landing_page | conversion |
|---|---|---|
| control | old_page | 0.1203863045004612 |
| treatment | new_page | 0.11880806551510564 |
| both | both | 0.11959708724499628 |
The difference between the probability of being converted by the new website and the old website in our population is \(obsdiff = -0.0015782389853555567\).
However, with this data, we cannot draw any conclusions so, let’s perform and A/B test.
A/B Test
The first part of an A/B test is defining the hypothesis and the error amount we want to accept. We should define a null hypothesis that we know it’s true and a an alternative one to reject the null. In this case:
\[H_0: p_{new} - p_{old} <= 0\] \[H_1: p_{new} - p_{old} > 0\]In other words, we know for sure that the old website is performing ‘better’ than the new one but we don’t know if the new one is going to perform better that the old one. Our objective with the test will be to know if we can reject our null hypothesis with the margin of error we have accepted (5%).
In this case, under the null, the probability of conversion is the same because we are assuming that the new website is going to perform equally or worse than the old one.
\[p_{new} = p_{old} = 0.11959708724499628\]The number of individuals are as followed:
\[n_{new} = 145310\] \[n_{old} = 145274\]With the python library numpy, we can simulate the \(p_{new}\) all the times we want. If we choose a big number of times, the result will be more consistent. By running the following code, we can calculate the difference in the probability of being converted by the different websites.
new_converted_simulation = np.random.binomial(n_new, p_new, 10000)/n_new
old_converted_simulation = np.random.binomial(n_old, p_old, 10000)/n_old
p_diffs = new_converted_simulation - old_converted_simulation
The code runs a simulation of the probability of being converted by the new website in the whole treatment group. Then it repeats it 10,000 times and perform the same with the probability of being converted by the old website with the whole control group. After that, it calculates the difference between probabilities.
By plotting the the difference between probabilities, we can get a view of their distribution.
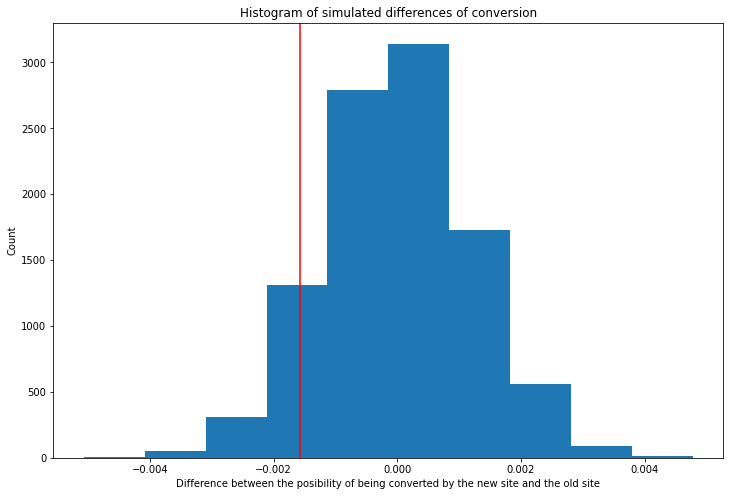
The red line shows the observed difference in the population (\(obsdiff = -0.0015782389853555567\)) that we calculated previously.
Now, it is important to know the proportion of values that are greater than the observed difference. In other words, how many values in the distribution are on the right side of the red line.
\[p-value = 0.9085\]The \(p-value\) means than 90% of the values are greater than the observed difference. It shows the probability of observing the statistic of our sample when the null hypothesis is true. It has to be less than the type 1 error margin to reject the null.
In this case, the \(p-value\) is 0.9085 which is more than error 1 margin (0.05) This means that we do not have enough evidence to reject the null and, if we did it, we would be incurring in the worst error possible: a fake positive.
Conclusions
After analyzing the dataset and performing an A/B testing, we do not have enough evidence to support the null hypothesis. In other words, we cannot say that the new website will bring more conversions based on the actual data. We would need to run the test for longer to check if the data changes or, discard the possibility of building a new website that way.
Thank you for reading until the end. If you are interested in knowing more about the calculations or a more detailed analysis, please, check my jupyter notebook.